GeoXml3 在 DIV 标签中显示来自 KML 文件的自定义字段
GeoXml3 Display Custom Field From KML File In A DIV Tag
我正在尝试从 KML 文件的自定义字段中获取数据,以便在从地图或边栏中选择该 KML 文件时显示在 div id=summary 部分中。我只是简单地复制了侧边栏 html 以制作摘要 html 部分,并希望 (Document/Folder/Placemark/summary.text) 处的 KML 内容显示在该 div 标记中。
<table style="width:100%;">
<tr>
<td>
<div id="loaddiv">Loading.....    please wait!
<br />
</div>
<div id="map_canvas">
</div>
</td>
<td>
<div id="sidebar" style="width:300px;height:600px; overflow:auto"></div>
</td>
<td>
<div id="summary" style="width:300px;height:600px; overflow:auto"></div>
</td>
</tr>
<tr>
<td colspan="2">
<div id="link"></div>
</td>
</tr>
</table>
我觉得这可能需要从 geoxml3.js 文件中覆盖一些函数。我在 geoxml3.js 中看到了包含以下内容的部分,似乎可能需要添加一些内容才能从 KML 文件中提取信息。
        placemark = {
          name:  geoXML3.nodeValue(node.getElementsByTagName('name')[0]),
          description: geoXML3.nodeValue(node.getElementsByTagName('description')[0]),
          styleUrl: geoXML3.nodeValue(node.getElementsByTagName('styleUrl')[0]),
          id: node.getAttribute('id')
        };
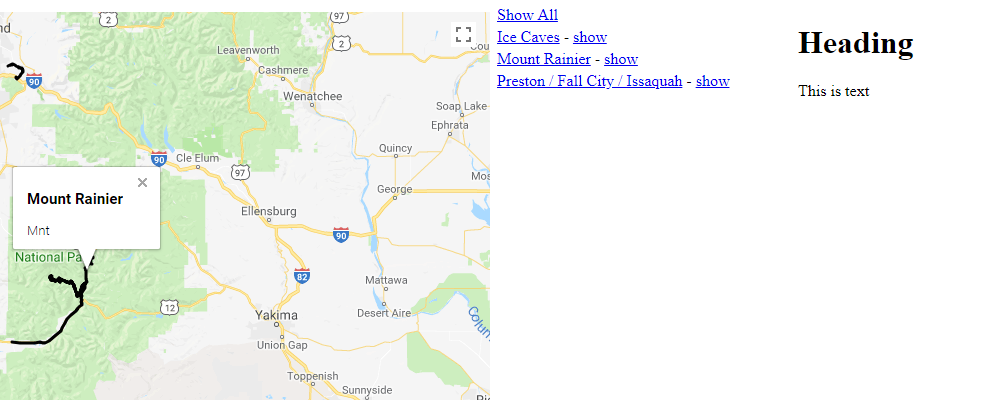
侧边栏栏旁边有摘要 table 栏的网站:
https://s20.postimg.cc/6jjcrnke5/geo1.png
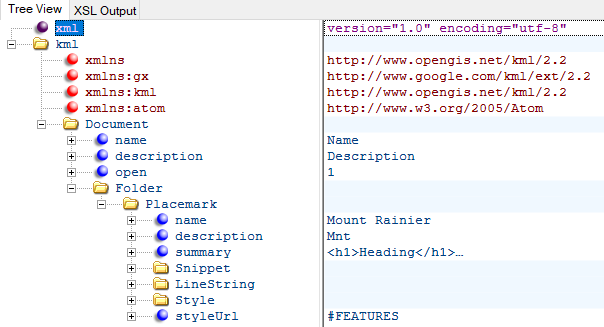
KML 文件XML 查看:
https://s20.postimg.cc/4eyzqkqh9/geo2.png
创建以下函数:
function showSummary(pm, doc) {
    summaryHtml = geoXmlDoc[doc].placemarks[pm].summary;
    document.getElementById("summary").innerHTML = summaryHtml;
}

function clickPoly(poly, polynum, doc) {
    google.maps.event.addListener(poly, "click", function() {
        showSummary(polynum, doc);
    });
}
在 function useTheData(doc) 行 highlightPoly(placemark.polygon, i, j); 下添加 clickPoly(placemark.polygon, i, j); 并在 highlightPoly(placemark.polyline, i, j); 行下添加 clickPoly(placemark.polyline, i, j);。
最后在function kmlPlClick(pm, doc)的第一行添加showSummary(pm, doc);。
- 为您的 KML 中的自定义标记创建自定义解析函数(解析来自 KML 的信息并填充由 geoxml3 处理的对象中的自定义字段
示例:http://www.geocodezip.com/geoxml3_test/votemap_address2.html)
// Custom placemark parse function
function parsePlacemark (node, placemark) {
      var summaryNodes = node.getElementsByTagName('summary');
      var summary = null;
      if (summaryNodes && summaryNodes.length && (summaryNodes .length > 0)) {
        placemark.summary = geoXML3.nodeValue(summaryNodes[0]);
      }
}
- 添加代码以在点击时将该信息放入
<div>(来自@PieDev 的回答):
function showSummary(pm, doc) {
    summaryHtml = geoXmlDoc[doc].placemarks[pm].summary;
    document.getElementById("summary").innerHTML = summaryHtml;
}

function clickPoly(poly, polynum, doc) {
    google.maps.event.addListener(poly, "click", function() {
        showSummary(polynum, doc);
    });
}

function kmlPlClick(pm,doc) {
   showSummary(pm, doc);
   if (geoXmlDoc[doc].placemarks[pm].polyline.getMap()) {
      google.maps.event.trigger(geoXmlDoc[doc].placemarks[pm].polyline,"click", {vertex: 0});
   } else {
      geoXmlDoc[doc].placemarks[pm].polyline.setMap(map);
      google.maps.event.trigger(geoXmlDoc[doc].placemarks[pm].polyline,"click", {vertex: 0});
   }
}

function useTheData(doc){
  var currentBounds = map.getBounds();
  if (!currentBounds) currentBounds=new google.maps.LatLngBounds();
  // Geodata handling goes here, using JSON properties of the doc object
  sidebarHtml = '<table><tr><td><a href="javascript:showAll();">Show All</a></td></tr>';
  geoXmlDoc = doc;
  for (var j = 0; j<geoXmlDoc.length;j++) {
   if (!geoXmlDoc[j] || !geoXmlDoc[j].placemarks || !geoXmlDoc[j].placemarks.length)
    continue;
   for (var i = 0; i < geoXmlDoc[j].placemarks.length; i++) {
    var placemark = geoXmlDoc[j].placemarks[i];
    if (placemark.polygon) {
      if (currentBounds.intersects(placemark.polygon.bounds)) {
        makeSidebarPolygonEntry(i,j);
      }
      var kmlStrokeColor = kmlColor(placemark.style.color);
      var kmlFillColor = kmlColor(placemark.style.fillcolor);
      var normalStyle = {
          strokeColor: kmlStrokeColor.color,
          strokeWeight: placemark.style.width,
          strokeOpacity: kmlStrokeColor.opacity,
          fillColor: kmlFillColor.color,
          fillOpacity: kmlFillColor.opacity
          };
      placemark.polygon.normalStyle = normalStyle;

      highlightPoly(placemark.polygon, i, j);
      clickPoly(placemark.polygon, i, j);
    }
    if (placemark.polyline) {
      if (currentBounds.intersects(placemark.polyline.bounds)) {
         makeSidebarPolylineEntry(i,j);
      }
      var kmlStrokeColor = kmlColor(placemark.style.color);
      var normalStyle = {
          strokeColor: kmlStrokeColor.color,
          strokeWeight: placemark.style.width,
          strokeOpacity: kmlStrokeColor.opacity
          };
      placemark.polyline.normalStyle = normalStyle;

      highlightPoly(placemark.polyline, i, j);
      clickPoly(placemark.polyline, i, j);
    }
    if (placemark.marker) {
      if (currentBounds.contains(placemark.marker.getPosition())) {
         makeSidebarEntry(i,j);
      }
    }

   }
  }
  sidebarHtml += "</table>";
  document.getElementById("sidebar").innerHTML = sidebarHtml;
};
我正在尝试从 KML 文件的自定义字段中获取数据,以便在从地图或边栏中选择该 KML 文件时显示在 div id=summary 部分中。我只是简单地复制了侧边栏 html 以制作摘要 html 部分,并希望 (Document/Folder/Placemark/summary.text) 处的 KML 内容显示在该 div 标记中。
<table style="width:100%;">
<tr>
<td>
<div id="loaddiv">Loading.....    please wait!
<br />
</div>
<div id="map_canvas">
</div>
</td>
<td>
<div id="sidebar" style="width:300px;height:600px; overflow:auto"></div>
</td>
<td>
<div id="summary" style="width:300px;height:600px; overflow:auto"></div>
</td>
</tr>
<tr>
<td colspan="2">
<div id="link"></div>
</td>
</tr>
</table>
我觉得这可能需要从 geoxml3.js 文件中覆盖一些函数。我在 geoxml3.js 中看到了包含以下内容的部分,似乎可能需要添加一些内容才能从 KML 文件中提取信息。
placemark = {
name: geoXML3.nodeValue(node.getElementsByTagName('name')[0]),
description: geoXML3.nodeValue(node.getElementsByTagName('description')[0]),
styleUrl: geoXML3.nodeValue(node.getElementsByTagName('styleUrl')[0]),
id: node.getAttribute('id')
};
侧边栏栏旁边有摘要 table 栏的网站: https://s20.postimg.cc/6jjcrnke5/geo1.png
KML 文件XML 查看: https://s20.postimg.cc/4eyzqkqh9/geo2.png
创建以下函数:
function showSummary(pm, doc) {
summaryHtml = geoXmlDoc[doc].placemarks[pm].summary;
document.getElementById("summary").innerHTML = summaryHtml;
}
function clickPoly(poly, polynum, doc) {
google.maps.event.addListener(poly, "click", function() {
showSummary(polynum, doc);
});
}
在 function useTheData(doc) 行 highlightPoly(placemark.polygon, i, j); 下添加 clickPoly(placemark.polygon, i, j); 并在 highlightPoly(placemark.polyline, i, j); 行下添加 clickPoly(placemark.polyline, i, j);。
最后在function kmlPlClick(pm, doc)的第一行添加showSummary(pm, doc);。
- 为您的 KML 中的自定义标记创建自定义解析函数(解析来自 KML 的信息并填充由 geoxml3 处理的对象中的自定义字段
示例:http://www.geocodezip.com/geoxml3_test/votemap_address2.html)
// Custom placemark parse function
function parsePlacemark (node, placemark) {
var summaryNodes = node.getElementsByTagName('summary');
var summary = null;
if (summaryNodes && summaryNodes.length && (summaryNodes .length > 0)) {
placemark.summary = geoXML3.nodeValue(summaryNodes[0]);
}
}
- 添加代码以在点击时将该信息放入
<div>(来自@PieDev 的回答):
function showSummary(pm, doc) {
summaryHtml = geoXmlDoc[doc].placemarks[pm].summary;
document.getElementById("summary").innerHTML = summaryHtml;
}
function clickPoly(poly, polynum, doc) {
google.maps.event.addListener(poly, "click", function() {
showSummary(polynum, doc);
});
}
function kmlPlClick(pm,doc) {
showSummary(pm, doc);
if (geoXmlDoc[doc].placemarks[pm].polyline.getMap()) {
google.maps.event.trigger(geoXmlDoc[doc].placemarks[pm].polyline,"click", {vertex: 0});
} else {
geoXmlDoc[doc].placemarks[pm].polyline.setMap(map);
google.maps.event.trigger(geoXmlDoc[doc].placemarks[pm].polyline,"click", {vertex: 0});
}
}
function useTheData(doc){
var currentBounds = map.getBounds();
if (!currentBounds) currentBounds=new google.maps.LatLngBounds();
// Geodata handling goes here, using JSON properties of the doc object
sidebarHtml = '<table><tr><td><a href="javascript:showAll();">Show All</a></td></tr>';
geoXmlDoc = doc;
for (var j = 0; j<geoXmlDoc.length;j++) {
if (!geoXmlDoc[j] || !geoXmlDoc[j].placemarks || !geoXmlDoc[j].placemarks.length)
continue;
for (var i = 0; i < geoXmlDoc[j].placemarks.length; i++) {
var placemark = geoXmlDoc[j].placemarks[i];
if (placemark.polygon) {
if (currentBounds.intersects(placemark.polygon.bounds)) {
makeSidebarPolygonEntry(i,j);
}
var kmlStrokeColor = kmlColor(placemark.style.color);
var kmlFillColor = kmlColor(placemark.style.fillcolor);
var normalStyle = {
strokeColor: kmlStrokeColor.color,
strokeWeight: placemark.style.width,
strokeOpacity: kmlStrokeColor.opacity,
fillColor: kmlFillColor.color,
fillOpacity: kmlFillColor.opacity
};
placemark.polygon.normalStyle = normalStyle;
highlightPoly(placemark.polygon, i, j);
clickPoly(placemark.polygon, i, j);
}
if (placemark.polyline) {
if (currentBounds.intersects(placemark.polyline.bounds)) {
makeSidebarPolylineEntry(i,j);
}
var kmlStrokeColor = kmlColor(placemark.style.color);
var normalStyle = {
strokeColor: kmlStrokeColor.color,
strokeWeight: placemark.style.width,
strokeOpacity: kmlStrokeColor.opacity
};
placemark.polyline.normalStyle = normalStyle;
highlightPoly(placemark.polyline, i, j);
clickPoly(placemark.polyline, i, j);
}
if (placemark.marker) {
if (currentBounds.contains(placemark.marker.getPosition())) {
makeSidebarEntry(i,j);
}
}
}
}
sidebarHtml += "</table>";
document.getElementById("sidebar").innerHTML = sidebarHtml;
};