在音频文件中查找音效
Find sound effect inside an audio file
我加载了 3 小时的 MP3 文件,每隔约 15 分钟播放一个独特的 1 秒音效,这标志着新章节的开始。
是否可以识别每次播放此音效的时间,以便我记下时间偏移?
每次的音效都差不多,但由于是有损文件格式编码,所以会有少量差异。
时间偏移量将存储在 ID3 Chapter Frame MetaData。
Example Source,其中音效播放两次
ffmpeg -ss 0.9 -i source.mp3 -t 0.95 sample1.mp3 -acodec copy -y
ffmpeg -ss 4.5 -i source.mp3 -t 0.95 sample2.mp3 -acodec copy -y
我对音频处理很陌生,但我最初的想法是提取 1 秒音效的样本,然后在 python 中使用 librosa 提取一个 floating point time series 对于这两个文件,将浮点数四舍五入,并尝试匹配。
import numpy
import librosa

print("Load files")

source_series, source_rate = librosa.load('source.mp3') # 3 hour file
sample_series, sample_rate = librosa.load('sample.mp3') # 1 second file

print("Round series")

source_series = numpy.around(source_series, decimals=5);
sample_series = numpy.around(sample_series, decimals=5);

print("Process series")

source_start = 0
sample_matching = 0
sample_length = len(sample_series)

for source_id, source_sample in enumerate(source_series):

    if source_sample == sample_series[sample_matching]:

        sample_matching += 1

        if sample_matching >= sample_length:

            print(float(source_start) / source_rate)

            sample_matching = 0

        elif sample_matching == 1:

            source_start = source_id;

    else:

        sample_matching = 0
这不适用于上面的 MP3 文件,但适用于 MP4 版本 - 它能够找到我提取的样本,但它只是那个样本(不是全部 12 个)。
我还应该注意到这个脚本只需要 1 分钟多一点的时间来处理 3 小时的文件(其中包括 237,426,624 个样本)。所以我可以想象,在每个循环上进行某种平均会导致这花费相当长的时间。
这是一个音频事件检测问题。如果声音总是一样的,并且没有其他声音同时出现,这可能可以通过模板匹配的方法来解决。至少如果没有其他含义相似的声音。
最简单的模板匹配是计算输入信号与模板之间的互相关。
- 截取一个要检测的声音示例(使用 Audacity)。尽可能多拿,但要避开开始和结束。将其存储为 .wav 文件
- 使用 librosa.load()
加载 .wav 模板
- 将输入文件分割成一系列重叠的帧。长度应与您的模板相同。可以用 librosa.util.frame
完成
- 迭代帧,并使用 numpy.correlate.
计算帧和模板之间的互相关
- 高互相关值表示匹配良好。可以应用阈值来决定什么是事件或不是。并且帧数可以用来计算事件发生的时间。
您可能应该准备一些较短的测试文件,其中包含一些要检测的声音示例以及其他典型声音。
如果录音的音量不一致,您需要在 运行 检测之前对其进行标准化。
如果时域中的互相关不起作用,您可以计算 melspectrogram 或 MFCC 特征并对其进行互相关。如果这也没有产生好的结果,可以使用监督学习来训练机器学习模型,但这需要将一堆数据标记为 event/not-event.
尝试在时域中直接匹配波形样本不是一个好主意。 mp3 信号将保留感知属性,但频率分量的相位很可能会发生偏移,因此样本值将不匹配。
您可以尝试匹配您的效果和样本的音量包络。
这个不太可能受mp3进程的影响。
首先,标准化您的样本,使嵌入效果与您的参考效果处于同一水平。通过使用刚好足够短以捕获相关特征的时间帧内的峰值平均值,从效果和样本构建新波形。最好还是使用重叠帧。然后在时域中使用互相关。
如果这不起作用,那么您可以使用 FFT 分析每个帧,这会为您提供每个帧的特征向量。然后,您尝试在您的效果中找到特征序列与样本的匹配项。类似于 https://whosebug.com/users/1967571/jonnor 建议。 MFCC 用于语音识别,但由于您没有检测语音 FFT 可能没问题。
我假设效果是自己播放的(没有背景噪音),它是通过电子方式添加到录音中的(而不是通过麦克风录音)。如果不是这种情况,问题就会变得更加困难。
这可能不是一个答案,它只是我在开始研究@jonnor 和@paul-john-leonard 的答案之前到达的地方。
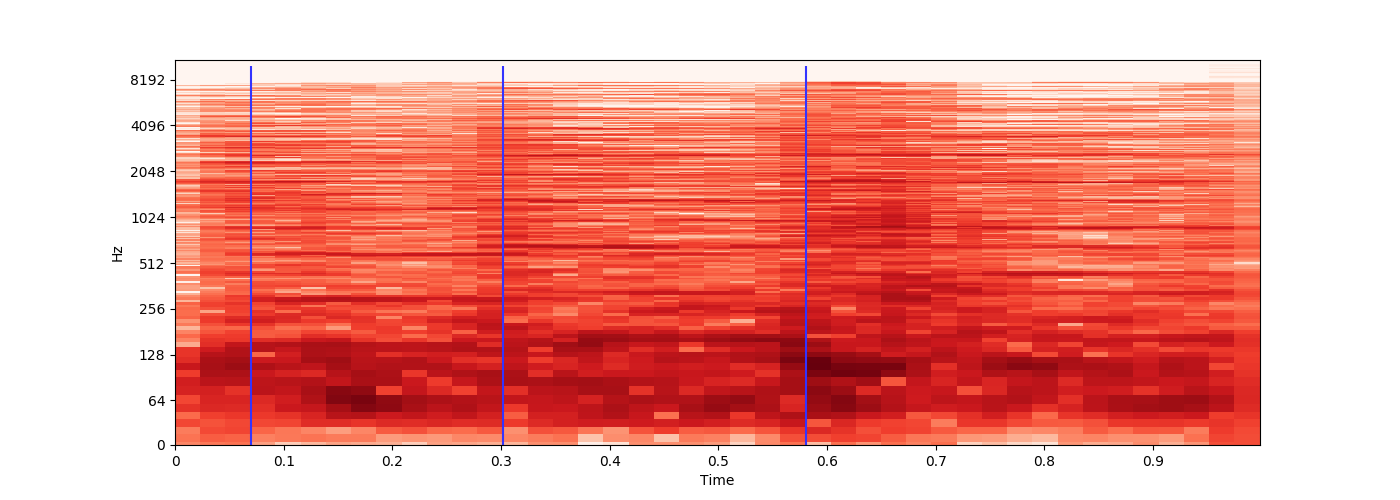
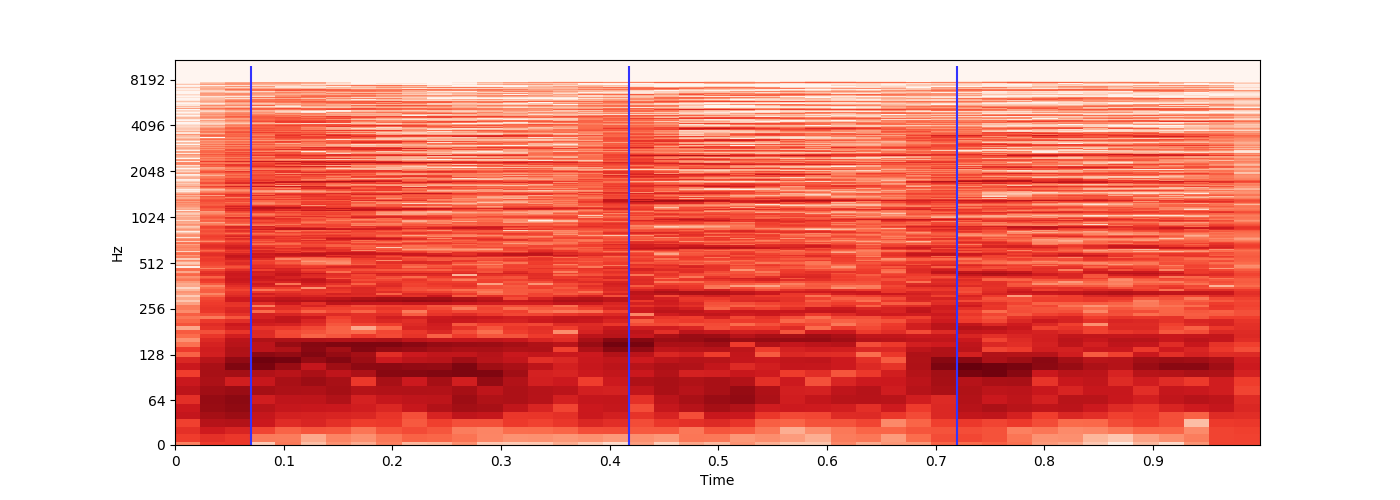
我正在查看使用 librosa stft 和 amplitude_to_db 可以获得的频谱图,并认为如果我将进入图表的数据进行一些舍入,我可能会找到正在播放的 1 音效:
https://librosa.github.io/librosa/generated/librosa.display.specshow.html
我在下面写的代码有点工作;虽然它:
return 有很多误报,可以通过调整被视为匹配项的参数来解决。
我需要将 librosa 函数替换为可以一次性解析、舍入和进行匹配检查的函数;因为一个 3 小时的音频文件导致 python 到 运行 在具有 16GB RAM 的计算机上内存不足,大约 30 分钟后它甚至到达舍入位。
import sys
import numpy
import librosa

#--------------------------------------------------

if len(sys.argv) == 3:
    source_path = sys.argv[1]
    sample_path = sys.argv[2]
else:
    print('Missing source and sample files as arguments');
    sys.exit()

#--------------------------------------------------

print('Load files')

source_series, source_rate = librosa.load(source_path) # The 3 hour file
sample_series, sample_rate = librosa.load(sample_path) # The 1 second file

source_time_total = float(len(source_series) / source_rate);

#--------------------------------------------------

print('Parse Data')

source_data_raw = librosa.amplitude_to_db(abs(librosa.stft(source_series, hop_length=64)))
sample_data_raw = librosa.amplitude_to_db(abs(librosa.stft(sample_series, hop_length=64)))

sample_height = sample_data_raw.shape[0]

#--------------------------------------------------

print('Round Data') # Also switches X and Y indexes, so X becomes time.

def round_data(raw, height):

    length = raw.shape[1]

    data = [];

    range_length = range(1, (length - 1))
    range_height = range(1, (height - 1))

    for x in range_length:

        x_data = []

        for y in range_height:

            # neighbours = []
            # for a in [(x - 1), x, (x + 1)]:
            #     for b in [(y - 1), y, (y + 1)]:
            #         neighbours.append(raw[b][a])
            #
            # neighbours = (sum(neighbours) / len(neighbours));
            #
            # x_data.append(round(((raw[y][x] + raw[y][x] + neighbours) / 3), 2))

            x_data.append(round(raw[y][x], 2))

        data.append(x_data)

    return data

source_data = round_data(source_data_raw, sample_height)
sample_data = round_data(sample_data_raw, sample_height)

#--------------------------------------------------

sample_data = sample_data[50:268] # Temp: Crop the sample_data (318 to 218)

#--------------------------------------------------

source_length = len(source_data)
sample_length = len(sample_data)
sample_height -= 2;

source_timing = float(source_time_total / source_length);

#--------------------------------------------------

print('Process series')

hz_diff_match = 18 # For every comparison, how much of a difference is still considered a match - With the Source, using Sample 2, the maximum diff was 66.06, with an average of ~9.9

hz_match_required_switch = 30 # After matching "start" for X, drop to the lower "end" requirement
hz_match_required_start = 850 # Out of a maximum match value of 1023
hz_match_required_end = 650
hz_match_required = hz_match_required_start

source_start = 0
sample_matched = 0

x = 0;
while x < source_length:

    hz_matched = 0
    for y in range(0, sample_height):
        diff = source_data[x][y] - sample_data[sample_matched][y];
        if diff < 0:
            diff = 0 - diff
        if diff < hz_diff_match:
            hz_matched += 1

    # print('  {} Matches - {} @ {}'.format(sample_matched, hz_matched, (x * source_timing)))

    if hz_matched >= hz_match_required:

        sample_matched += 1

        if sample_matched >= sample_length:

            print('      Found @ {}'.format(source_start * source_timing))

            sample_matched = 0 # Prep for next match

            hz_match_required = hz_match_required_start

        elif sample_matched == 1: # First match, record where we started

            source_start = x;

        if sample_matched > hz_match_required_switch:

            hz_match_required = hz_match_required_end # Go to a weaker match requirement

    elif sample_matched > 0:

        # print('  Reset {} / {} @ {}'.format(sample_matched, hz_matched, (source_start * source_timing)))

        x = source_start # Matched something, so try again with x+1

        sample_matched = 0 # Prep for next match

        hz_match_required = hz_match_required_start

    x += 1

#--------------------------------------------------
跟进@jonnor 和@paul-john-leonard 的回答,他们都是正确的,通过使用帧 (FFT),我能够进行音频事件检测。
我已经在以下位置编写了完整的源代码:
https://github.com/craigfrancis/audio-detect
一些注意事项:
为了创建模板,我使用了 ffmpeg:
ffmpeg -ss 13.15 -i source.mp4 -t 0.8 -acodec copy -y templates/01.mp4;
我决定使用 librosa.core.stft,但我需要为我正在分析的 3 小时文件自己实现这个 stft 函数,因为它太长了大到可以保存在内存中。
当使用 stft 时,我首先尝试使用 64 的 hop_length,而不是默认值 (512),因为我认为这会给我更多的工作数据与...理论可能是正确的,但 64 太详细了,导致它大部分时间都失败了。
我仍然不知道如何使帧和模板之间的互相关起作用(通过 numpy.correlate)...相反,我获取了每帧的结果(1025 个桶,不是 1024,我认为这与找到的 Hz 频率有关)并做了一个非常简单的平均差异检查,然后确保平均值高于某个值(我的测试用例工作在 0.15,我使用它的主要文件需要 0.55 - 大概是因为主要文件被压缩得更多了):
hz_score = abs(source[0:1025,x] - template[2][0:1025,y])
hz_score = sum(hz_score)/float(len(hz_score))
检查这些分数时,将它们显示在图表上非常有用。我经常使用如下内容:
import matplotlib.pyplot as plt
plt.figure(figsize=(30, 5))
plt.axhline(y=hz_match_required_start, color='y')
while x < source_length:
debug.append(hz_score)
if x == mark_frame:
plt.axvline(x=len(debug), ymin=0.1, ymax=1, color='r')
plt.plot(debug)
plt.show()
当你创建模板时,你需要trim关闭任何领先的沉默(以避免错误的匹配),以及额外的 ~5 帧(似乎压缩/重新编码过程改变了这一点)...同样,删除最后 2 帧(我认为这些帧包含一些来自周围环境的数据,特别是最后一个可能有点偏离)。
当您开始寻找匹配项时,您可能会发现前几帧没问题,然后就失败了……您可能需要在一两帧后重试。我发现有一个支持多个模板(声音略有变化)的过程会更容易,并且会检查它们的第一个可测试(例如第 6 个)帧,如果匹配,则将它们放入潜在匹配列表中。然后,随着它继续处理源的下一帧,它可以将其与模板的下一帧进行比较,直到模板中的所有帧都匹配(或失败)。
我加载了 3 小时的 MP3 文件,每隔约 15 分钟播放一个独特的 1 秒音效,这标志着新章节的开始。
是否可以识别每次播放此音效的时间,以便我记下时间偏移?
每次的音效都差不多,但由于是有损文件格式编码,所以会有少量差异。
时间偏移量将存储在 ID3 Chapter Frame MetaData。
Example Source,其中音效播放两次
ffmpeg -ss 0.9 -i source.mp3 -t 0.95 sample1.mp3 -acodec copy -y
ffmpeg -ss 4.5 -i source.mp3 -t 0.95 sample2.mp3 -acodec copy -y
我对音频处理很陌生,但我最初的想法是提取 1 秒音效的样本,然后在 python 中使用 librosa 提取一个 floating point time series 对于这两个文件,将浮点数四舍五入,并尝试匹配。
import numpy
import librosa
print("Load files")
source_series, source_rate = librosa.load('source.mp3') # 3 hour file
sample_series, sample_rate = librosa.load('sample.mp3') # 1 second file
print("Round series")
source_series = numpy.around(source_series, decimals=5);
sample_series = numpy.around(sample_series, decimals=5);
print("Process series")
source_start = 0
sample_matching = 0
sample_length = len(sample_series)
for source_id, source_sample in enumerate(source_series):
if source_sample == sample_series[sample_matching]:
sample_matching += 1
if sample_matching >= sample_length:
print(float(source_start) / source_rate)
sample_matching = 0
elif sample_matching == 1:
source_start = source_id;
else:
sample_matching = 0
这不适用于上面的 MP3 文件,但适用于 MP4 版本 - 它能够找到我提取的样本,但它只是那个样本(不是全部 12 个)。
我还应该注意到这个脚本只需要 1 分钟多一点的时间来处理 3 小时的文件(其中包括 237,426,624 个样本)。所以我可以想象,在每个循环上进行某种平均会导致这花费相当长的时间。
这是一个音频事件检测问题。如果声音总是一样的,并且没有其他声音同时出现,这可能可以通过模板匹配的方法来解决。至少如果没有其他含义相似的声音。
最简单的模板匹配是计算输入信号与模板之间的互相关。
- 截取一个要检测的声音示例(使用 Audacity)。尽可能多拿,但要避开开始和结束。将其存储为 .wav 文件
- 使用 librosa.load() 加载 .wav 模板
- 将输入文件分割成一系列重叠的帧。长度应与您的模板相同。可以用 librosa.util.frame 完成
- 迭代帧,并使用 numpy.correlate. 计算帧和模板之间的互相关
- 高互相关值表示匹配良好。可以应用阈值来决定什么是事件或不是。并且帧数可以用来计算事件发生的时间。
您可能应该准备一些较短的测试文件,其中包含一些要检测的声音示例以及其他典型声音。
如果录音的音量不一致,您需要在 运行 检测之前对其进行标准化。
如果时域中的互相关不起作用,您可以计算 melspectrogram 或 MFCC 特征并对其进行互相关。如果这也没有产生好的结果,可以使用监督学习来训练机器学习模型,但这需要将一堆数据标记为 event/not-event.
尝试在时域中直接匹配波形样本不是一个好主意。 mp3 信号将保留感知属性,但频率分量的相位很可能会发生偏移,因此样本值将不匹配。
您可以尝试匹配您的效果和样本的音量包络。 这个不太可能受mp3进程的影响。
首先,标准化您的样本,使嵌入效果与您的参考效果处于同一水平。通过使用刚好足够短以捕获相关特征的时间帧内的峰值平均值,从效果和样本构建新波形。最好还是使用重叠帧。然后在时域中使用互相关。
如果这不起作用,那么您可以使用 FFT 分析每个帧,这会为您提供每个帧的特征向量。然后,您尝试在您的效果中找到特征序列与样本的匹配项。类似于 https://whosebug.com/users/1967571/jonnor 建议。 MFCC 用于语音识别,但由于您没有检测语音 FFT 可能没问题。
我假设效果是自己播放的(没有背景噪音),它是通过电子方式添加到录音中的(而不是通过麦克风录音)。如果不是这种情况,问题就会变得更加困难。
这可能不是一个答案,它只是我在开始研究@jonnor 和@paul-john-leonard 的答案之前到达的地方。
我正在查看使用 librosa stft 和 amplitude_to_db 可以获得的频谱图,并认为如果我将进入图表的数据进行一些舍入,我可能会找到正在播放的 1 音效:
https://librosa.github.io/librosa/generated/librosa.display.specshow.html
我在下面写的代码有点工作;虽然它:
return 有很多误报,可以通过调整被视为匹配项的参数来解决。
我需要将 librosa 函数替换为可以一次性解析、舍入和进行匹配检查的函数;因为一个 3 小时的音频文件导致 python 到 运行 在具有 16GB RAM 的计算机上内存不足,大约 30 分钟后它甚至到达舍入位。
import sys
import numpy
import librosa
#--------------------------------------------------
if len(sys.argv) == 3:
source_path = sys.argv[1]
sample_path = sys.argv[2]
else:
print('Missing source and sample files as arguments');
sys.exit()
#--------------------------------------------------
print('Load files')
source_series, source_rate = librosa.load(source_path) # The 3 hour file
sample_series, sample_rate = librosa.load(sample_path) # The 1 second file
source_time_total = float(len(source_series) / source_rate);
#--------------------------------------------------
print('Parse Data')
source_data_raw = librosa.amplitude_to_db(abs(librosa.stft(source_series, hop_length=64)))
sample_data_raw = librosa.amplitude_to_db(abs(librosa.stft(sample_series, hop_length=64)))
sample_height = sample_data_raw.shape[0]
#--------------------------------------------------
print('Round Data') # Also switches X and Y indexes, so X becomes time.
def round_data(raw, height):
length = raw.shape[1]
data = [];
range_length = range(1, (length - 1))
range_height = range(1, (height - 1))
for x in range_length:
x_data = []
for y in range_height:
# neighbours = []
# for a in [(x - 1), x, (x + 1)]:
# for b in [(y - 1), y, (y + 1)]:
# neighbours.append(raw[b][a])
#
# neighbours = (sum(neighbours) / len(neighbours));
#
# x_data.append(round(((raw[y][x] + raw[y][x] + neighbours) / 3), 2))
x_data.append(round(raw[y][x], 2))
data.append(x_data)
return data
source_data = round_data(source_data_raw, sample_height)
sample_data = round_data(sample_data_raw, sample_height)
#--------------------------------------------------
sample_data = sample_data[50:268] # Temp: Crop the sample_data (318 to 218)
#--------------------------------------------------
source_length = len(source_data)
sample_length = len(sample_data)
sample_height -= 2;
source_timing = float(source_time_total / source_length);
#--------------------------------------------------
print('Process series')
hz_diff_match = 18 # For every comparison, how much of a difference is still considered a match - With the Source, using Sample 2, the maximum diff was 66.06, with an average of ~9.9
hz_match_required_switch = 30 # After matching "start" for X, drop to the lower "end" requirement
hz_match_required_start = 850 # Out of a maximum match value of 1023
hz_match_required_end = 650
hz_match_required = hz_match_required_start
source_start = 0
sample_matched = 0
x = 0;
while x < source_length:
hz_matched = 0
for y in range(0, sample_height):
diff = source_data[x][y] - sample_data[sample_matched][y];
if diff < 0:
diff = 0 - diff
if diff < hz_diff_match:
hz_matched += 1
# print(' {} Matches - {} @ {}'.format(sample_matched, hz_matched, (x * source_timing)))
if hz_matched >= hz_match_required:
sample_matched += 1
if sample_matched >= sample_length:
print(' Found @ {}'.format(source_start * source_timing))
sample_matched = 0 # Prep for next match
hz_match_required = hz_match_required_start
elif sample_matched == 1: # First match, record where we started
source_start = x;
if sample_matched > hz_match_required_switch:
hz_match_required = hz_match_required_end # Go to a weaker match requirement
elif sample_matched > 0:
# print(' Reset {} / {} @ {}'.format(sample_matched, hz_matched, (source_start * source_timing)))
x = source_start # Matched something, so try again with x+1
sample_matched = 0 # Prep for next match
hz_match_required = hz_match_required_start
x += 1
#--------------------------------------------------
跟进@jonnor 和@paul-john-leonard 的回答,他们都是正确的,通过使用帧 (FFT),我能够进行音频事件检测。
我已经在以下位置编写了完整的源代码:
https://github.com/craigfrancis/audio-detect
一些注意事项:
为了创建模板,我使用了 ffmpeg:
ffmpeg -ss 13.15 -i source.mp4 -t 0.8 -acodec copy -y templates/01.mp4;我决定使用
librosa.core.stft,但我需要为我正在分析的 3 小时文件自己实现这个stft函数,因为它太长了大到可以保存在内存中。当使用
stft时,我首先尝试使用 64 的 hop_length,而不是默认值 (512),因为我认为这会给我更多的工作数据与...理论可能是正确的,但 64 太详细了,导致它大部分时间都失败了。我仍然不知道如何使帧和模板之间的互相关起作用(通过
numpy.correlate)...相反,我获取了每帧的结果(1025 个桶,不是 1024,我认为这与找到的 Hz 频率有关)并做了一个非常简单的平均差异检查,然后确保平均值高于某个值(我的测试用例工作在 0.15,我使用它的主要文件需要 0.55 - 大概是因为主要文件被压缩得更多了):hz_score = abs(source[0:1025,x] - template[2][0:1025,y])
hz_score = sum(hz_score)/float(len(hz_score))检查这些分数时,将它们显示在图表上非常有用。我经常使用如下内容:
import matplotlib.pyplot as plt
plt.figure(figsize=(30, 5))
plt.axhline(y=hz_match_required_start, color='y')while x < source_length:
debug.append(hz_score)
if x == mark_frame:
plt.axvline(x=len(debug), ymin=0.1, ymax=1, color='r')plt.plot(debug)
plt.show()当你创建模板时,你需要trim关闭任何领先的沉默(以避免错误的匹配),以及额外的 ~5 帧(似乎压缩/重新编码过程改变了这一点)...同样,删除最后 2 帧(我认为这些帧包含一些来自周围环境的数据,特别是最后一个可能有点偏离)。
当您开始寻找匹配项时,您可能会发现前几帧没问题,然后就失败了……您可能需要在一两帧后重试。我发现有一个支持多个模板(声音略有变化)的过程会更容易,并且会检查它们的第一个可测试(例如第 6 个)帧,如果匹配,则将它们放入潜在匹配列表中。然后,随着它继续处理源的下一帧,它可以将其与模板的下一帧进行比较,直到模板中的所有帧都匹配(或失败)。